|
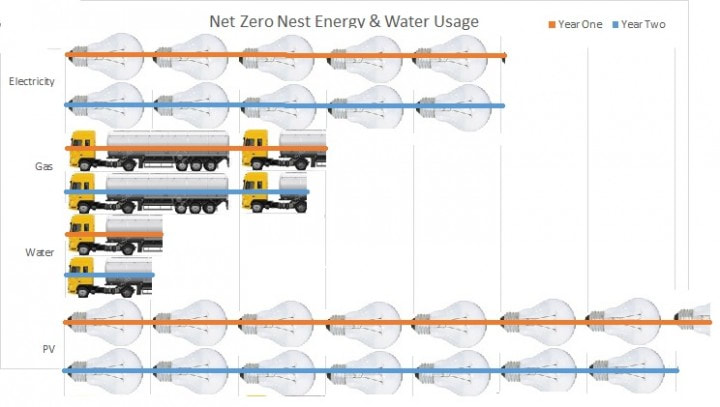
Our house used very close to the energy predicted by the models when we designed it. The above chart shows the energy usage in terms of intuitive quantities… We used about the same amount of electricity as if we left 5 100W lightbulbs on constantly, and we produced as much with our PV panels as 7 of those bulbs would use. In an average month, we consumed about 1 and a half tanker trucks of natural gas and half a tanker truck of water, and year 2 was very similar to year 1.
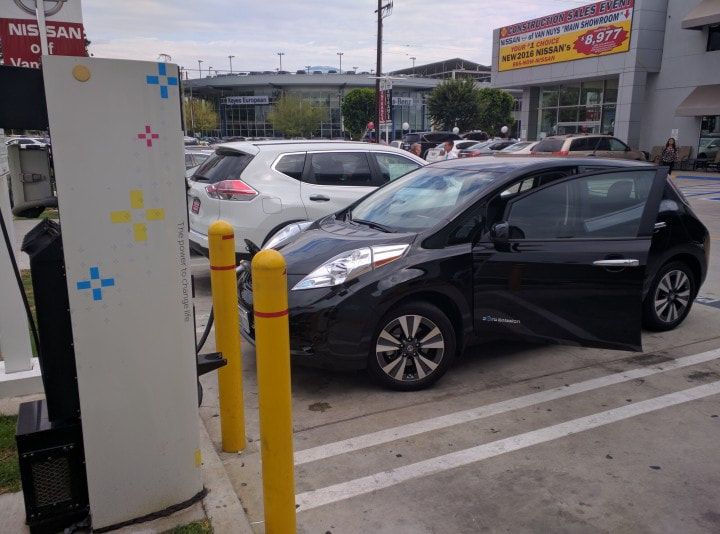
Each year, our net-zero energy calculation came out to 59% site net-zero. In layman’s terms, this means we produced 59% onsite with our PV panels of what we used in gas and electricity, with gas converted to kWh equivalent units. Note that California uses a time-dependent weighted valuation or TDV to compute net-zero, which weighs peak period production and consumption more heavily than off-peak. This makes achieving TDV net-zero more practical (easier) than site net-zero. Put another way, if we added 10 more PV panels to our 16, we would be site net-zero. By the California definition of TDV net zero, our house is meeting that net-zero goal as it was designed to do. We added an electric vehicle in Year 2, which is using up the extra PV production at a rate of about 200 kWh/month. That allows our Nissan Leaf to cover about 1,000 miles per month, when charging at public stations is included. Let’s look at the cost per mile. We paid $13,000 after incentives for our PV system, which generates roughly 6,250 kWh/yr. That works out to a cost of $0.10/kWh over 20 years. At 4 miles/kWh, the Leaf’s operating cost per mile is 2.5 cents. Our gas car gets 30 mpg @ $3.00/gallon, or 10 cents per mile. So the cost per mile when an EV is paired with PV panels is 1/4 that of a gas car. That is saving us $900 per year! Here are the raw numbers for you to compare your usage to. Let us know — is your house performing better than Net Zero Nest? How is your electric vehicle working out for you? We would love to hear from you. Year 1 Year 2 Electricity, kWh 4455 4423 Gas, therms 225 207 Water, cuft 8900 7300 PV production, kWh 6523 6142
3 Comments
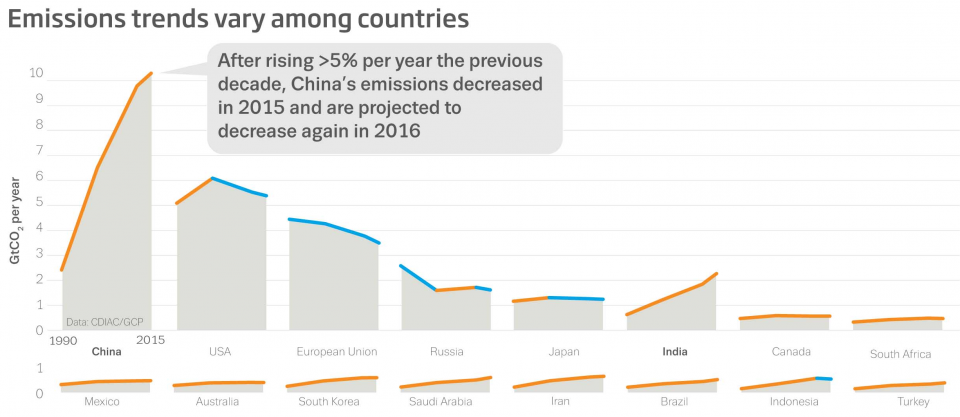
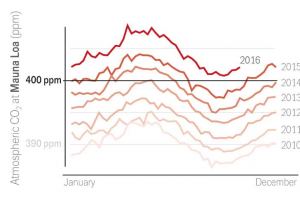
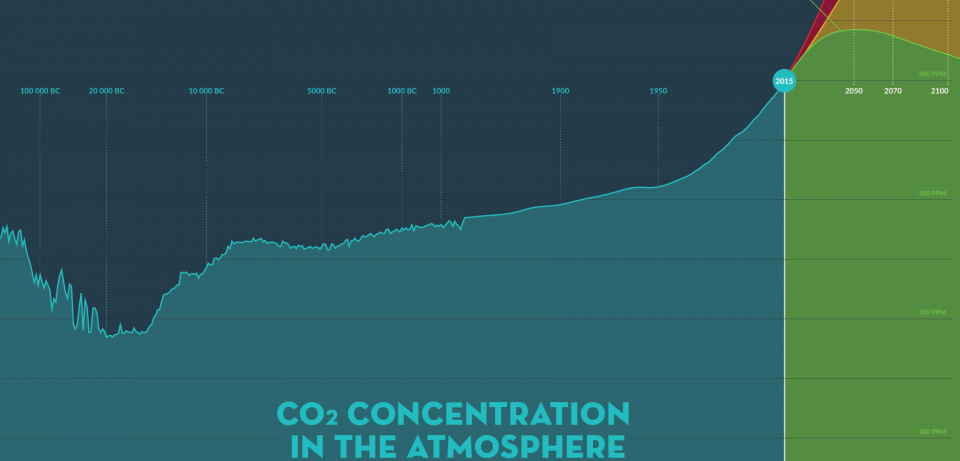
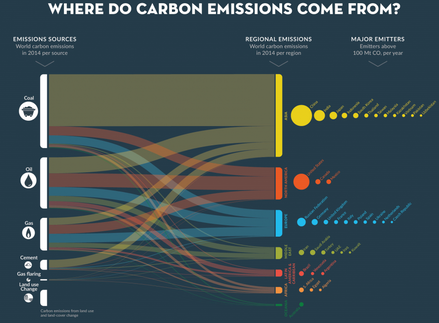
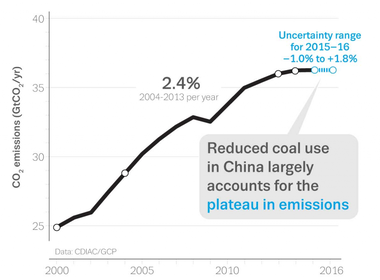 Global carbon emissions topping out Global carbon emissions topping out I LOVE LOVE LOVE the work that the Global Carbon Project is doing to help us understand the problem of carbon dioxide emissions. It’s a heavily nuanced problem, without direct causality that is relatable to everyone. That’s why there’s such disagreement on this issue — many people need to see it with their own eyes to believe something. And that’s impossible to do to everyone’s satisfaction with this issue. Great News – Peak Emissions This story should be front page news … that humans have gone 4 years with largely flat carbon emissions. This shows the progress we’ve made in the early response to the crisis. Switches worldwide from coal to natural gas played a large part in this progress, and economics were thankfully on the side of carbon reduction during this period — natural gas prices were historically low. Before climate change skeptics seize on this and spin my post to serve their ends, realize this: global carbon concentration will continue increasing until we cut emissions to near zero. We have much work left to do, but can take short-term solace in our progress to turn the graph back down. China Progressing; US, Russia, Europe, Japan Leading, India Problematic This chart shows the last 25 years of emissions by country, and clearly shows the leadership of the developed world on reducing emissions, even Putin’s Russia. China has turned concave down, but India is still concave up, with accelerating emissions. Add up the other developing countries and they are a significant part of the problem to manage, politics aside. Are We There Yet? NO! This next chart shows carbon dioxide concentrations at the Mauna Loa measurement station in Hawaii, chosen for its remote location and ability to measure global trends rather than national ones. From 2010-2016, carbon concentrations have increased from 390 ppm to 400+, and each year the level has stayed elevated above the prior year, showing a clear trend. And the historical argument that many have made is shown back to 100,000 BC. This chart shows natural variation, but a clear departure around 1950, as we humans outstripped the planet’s ability to process our waste. And going forward from 2015, the chart shows various scenarios of human activity and their effect on carbon concentration. I have clipped the graphic here to show only the best case scenario, in which people are able to get together and bring down carbon emissions to near zero. Where’s it Come From?
This final chart shows the source and location of global carbon emissions in a spectacular display of complex information… so go ahead and digest all this… it’s a lot to process. But it’s an under-publicized story that should be discussed at every dinner table and bar and water cooler. With so many variables, it’s hard to decide on an EV. Here’s what we grappled with in our decision to (Spoiler Alert) lease a 2016 Nissan Leaf:
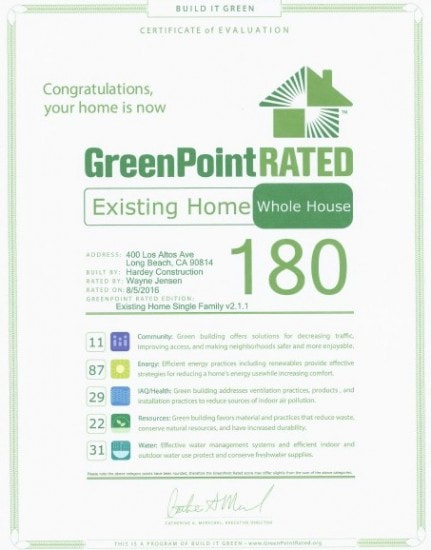
1. Range anxiety (at 110 miles per charge, is that enough for our family?) 2. Understanding federal and state incentives 3. Degradation in battery life over time – how real is this? 4. Drive-ability 5. Room for 5 people comfortably? 6. Newer models coming out (Tesla 3 and Chevy Bolt) 7. Cost of operation vs gas vehicle 8. How do you install a charger (EVSE) in the garage? 9. How much could we use our solar panels to charge it versus off-grid power? 10. Are those HOV stickers still available in California? 11. Lease vs buy 12. Hybrid vs Pure EV And here is what we found out and decided: 1. Range anxiety is real but do-able with planning ahead At 110 miles, that’s 50 miles each way with a 10-mile cushion. Luckily stop-and-go traffic seems to help EVs, since they regenerate some energy during braking, the opposite of gas cars. So the 10-mile cushion seems fairly safe. With the ability to trickle charge at your destination, that can add 5-10 miles per hour, and that’s possible with a standard 110V outlet and the free cable that comes with the car. With a 240V Series 2 charger on the other end, you can add 20 miles per hour to your battery and really extend your range. And if you plan around a DC charger, such as most Nissan dealers have, you can go 80+ miles, get an 80% recharge in 30 minutes and head home. So for us, we have a gas car for long trips and we will use the EV for all around town and mid-range trips of 50 miles or less, 80 miles or less with ability to charge on the other end. 2. Federal and state incentives The dealers were offering $7,500 federal rebates, and $2,500 state rebates in California, although the state money was contingent of renewal of the program, so we couldn’t take that for granted. By leasing, the $7,500 was rolled into the deal, along with other dealer incentives that pushed the capital cost reduction well over $10K. We’ll hope to get the state rebate, too. The government continues to do its best to give EVs a start in the market dominated by internal combustion engines. 3. Degradation of battery life over time The research we made showed we could expect 70% battery life after 5 years or so, and that charging behavior is a key determining factor in this. Just like a cellphone battery, if you charge it often, the battery loses its ability to hold a charge faster. So we’ve been trying to run it down under 50% before recharging. But if we have a possible trip the next day, we’ll have to top it off in the garage. With a lease, this is not a large issue. 4. Drive-ability This is answered by test driving, and your local dealer would love you to do so, because they’re so convinced you’ll be hooked that you’ll probably get one. They really are a joy to drive. The big difference I noticed right away was acceleration. There is no delay between putting the pedal down and the engine responding, so it’s peppy. Acceleration on the freeway onramp is scary easy. And the Leaf handles turns and braking nicely as well. I’ve never been so excited about driving a new car as this one, and I’ve probably driven a dozen new cars over the years. 5. Room for 5 people Because they have to count their pounds like the Weight Watchers of car designers, EVs are not as roomy as their gas cousins. But I found the Leaf had plenty of room for 3 in the back seat 6. Wait for new models or pull the trigger now? We had a career change that made this decision for us. And the 3-year lease gives us a timetable to get to where the new Teslas, Chevys, and Nissans have worked out some bugs and extended range on affordable models to 200+ miles. Then our next EV can be all the car we’d ever need to go between LA and San Francisco with one stop or go to the mountains. But if I had a car with 2 years left in it, I would have run it into the ground and waited for the next generation of EVs. 7. Cost of operation This breaks down into gas vs electricity cost and maintenance and insurance cost differences, if any. Let’s assume we’re getting 3.8 miles/kwh on the Leaf (which we are). At $0.20/kwh, that’s about $0.05/mile. A comparable gas car might get 30 miles per gallon on $3/gallon gas. That’s $0.10/mile (double). Plus, maintenance should be much less for an EV, with fewer moving parts under the hood. And insurance on the Leaf was less than our other cars. So we stand to save $750/yr on gas alone at 15,000 miles/yr. 8. Chargers 101 You don’t call it a charger, first of all! The EV community seems pretty stubborn about calling them EVSE’s. So we’ll have to go with that until a TV show character gives one a cooler name. For now, I’ll call it a charger. I found some for $300, but ended up getting a Clipper Creek one for $600 that everyone swore by. I had a 30 amp RV plug at 240V already on the back of the garage, and planned to use that. But that could only handle the 24 amp charger. The 32 amp charger would make a big difference in charging speed, so I had my electrician upgrade the breaker to 40 amps and ran a new line in the garage. It is charging from nothing to full in about 5 hours. The brains of the whole charging thing is in the car. The car knows when to turn off the charger. The car can set a timer to turn on and off at a certain time to take advantage of off-peak electric rates. All you need that EVSE to do then is safely move the current. You might spend your first year’s gas savings on an EVSE and installation. 9. Using solar power to charge the car We have an excess of solar PV capacity on the roof of about 1,000 kwh/year, or 3,800 miles per year worth. The utility pays us $0.04/kwh for that power, as part of our net metering agreement, so that’s a bum deal. We might as well use it for an EV. That means the first 3,800 miles per year are at $0.01/mile. Then we start paying Tier I rates from the utility. But, even in the middle of summer in the middle of the day, when our PV panels are maxed out, they only produce 4 kw, and the charger uses 6.6 kw, so we can’t charge at full blast without help from the grid. All that comes out in the end-of-year wash, when the utility calculates what we took versus what we returned to the grid, regardless of what time of day it was. Net metering is a good deal for the consumer, who gets to use the grid whenever their panels can’t power them as a virtual battery, and just clear up their account at the end of the year, like those general store owners used to do in all the Westerns when the farmers sold their crops for the year and bought their wives and daughters fabric to make dresses. 10. HOV stickers in California We wanted one of those mud flap stickers like on those Priuses when they first started strutting their environmental superiority over our gas cars 15 years ago. But we also heard those stickers aren’t available any more. Well it seems that’s true, for hybrid EVs (check your specific model at the DMV website). But for our ZEV (zero emission vehicle), they have a shiny white HOV lane sticker available by mail for $22, once you get your registration in the mail. And until then, you can drive the carpool lane with impunity since you have no plates; just watch for the highway patrolman. 11. Lease vs buy We bought our solar panels when leasing them would have been easier, so we’re not lease lovers. But with the longer range models coming online in the next year or two, and the dealers’ willingness to take all the uncertainty and paperwork out of the federal rebate process for us, and a sub-$300/month lease on offer with a reasonable downpayment, we decided on the 15,000/mile a year lease. 12. Hybrid vs Pure EV A plug-in hybrid seems like the perfect compromise … the economy of an EV driving around town near home with the range of a regular gas car. But we just wanted to make more of a statement than that … that we can plan around limited range and charging stations to make an electric vehicle with no emissions work. And why spend an extra $2,000 or so to have a redundant engine under the hood – that’s not a no-cost compromise. My wife and I just have come to believe through our research that the natural gas plant down the street can burn gas and make electricity and get it to our house to charge our car more efficiently than the oil companies can get gasoline to the gas station by way of the refinery by way of the ship from the Middle East for my gas engine to burn. And if 30-50% of the power comes from my rooftop solar panels or solar panels in the Mojave Desert or hydropower, then I think that makes a pure EV make good sense now and, even more so, in future. UPDATE: NOW GETTING 4.2 MILES PER KWH. Mileage is better around town and worse at high speed on the freeways, the reverse of ICE cars (my new term for internal combustion engine cars that makes them seem not quite so much the automatic standard type of car). The Build it Green rating system helped guide our remodel project from start to finish. During the design phase, we went through the GreenPoint Rated scoring criteria one by one, selecting which credits we wanted to build into our project. The checklist pointed out some ideas we never would have thought of on our own, and helped us cut through the universe of possibilities and focus in on areas that the smart people who developed the system had already thought through. We achieved almost every single credit we attempted, and are very proud of our score of 180 points. We scored most of our points for energy efficiency, but also scored well for indoor air quality, sustainable resources, water, and community. For more information, check out the GreenPoint Rated website.
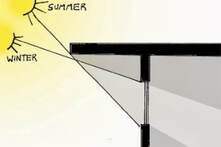 Passive solar theory takes advantage of the different height of the Sun in Summer and Winter Passive solar theory takes advantage of the different height of the Sun in Summer and Winter Whether you think of it as common sense shading, or if you treat it as a scientific approach to energy efficient passive solar design, every new and remodeled home project should carefully consider these principles:
How Much Awning Do I Need? The general principle is to fully shade the window in the middle of Summer, which in the Northern Hemisphere is June 21. To accomplish this goal, you can go outside on June 21 with a ruler, which I recently did because I was bored. But more practical is to use a little math. We can do this the easy way or the hard way. Easy way The table below shows a multiplier based on your latitude that will give you a multiplier for the window height. If you live at 34 degrees Latitude like me, you might use a range from 3.5 to 5.5. That means the height of the window should be 3.5 to 5.5 times the projection of the awning out from the walls of your house. My 38” window suggested 7-11” projection for my awning. I figure since it stays hot here into August, I might use the 11”. But that will mean less free solar heating in Winter time, since that 11” will shade the window a little more. 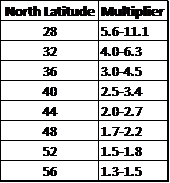 The Multiplier tells you how high a window will be fully shaded on June 21 by an awning of a given size The Multiplier tells you how high a window will be fully shaded on June 21 by an awning of a given size Hard way I actually understood the use of latitude a lot better in this method. If you take the Sun’s position June 21 as 23.5 degrees, and subtract that from your latitude, it gives you the angle of the sunlight on June 21. For Long Beach, that was 34-23.5 = 10.5 degrees. That means that the sun is 10 degrees from fully above the house on June 21, so a small projection shades a lot of window. By my calculations, a 7” awning would exactly shade the window on June 21. A 11” awning would shade 59”. Somewhere in between is the ideal awning projection. On December 21, the Sun’s position is 23.5 degrees negative. Subtract that from your latitude, and you get 57.5 degrees. That’s a lot of sun getting on my 38” window; about 31” out of 38” will get Sun on December 21, allowing for a lot of heat to get in (if I design my windows to be medium to high solar heat gain). This is the passive solar analysis – how much of a projection out from the house is needed to precisely shade the window at the height of Summer, but let the lower Winter Sun shine directly into the house in the Winter? A little effort spent calculating the right shading for South-facing windows will minimize Summer heat gain and maximize passive heating in Winter. In our case, two simple window awnings at 11″ deep reduced overall space conditioning energy usage by 2%. 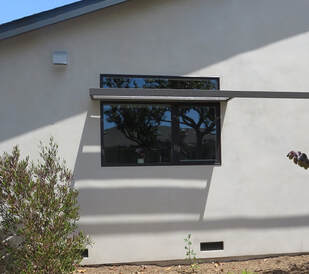 Shade on June 21, 2015 Shade on June 21, 2015 UPDATE: How our window looked on June 21, 2015 The theoretical guidelines said to use a 7″ overhang and we’d fully shade the window on June 21. Our knowledge of our climate pushed us to consider a deeper overhang to shade the window into July and August, so we built it to 11″. Sure enough, on June 21, that 11″ overhang more than shaded the window. As the photo shows, it would have been enough to shade a window of almost twice the height. As it is, the 11″ overhang seems minimal, and a 7″ overhang would have seemed a little “stubby” from an aesthetic viewpoint. See those gaps where the sunlight comes through? Those were mistakes. When we built the angled slats, they should have been built taller, so that they fully shut out the sun on June 21. But they were built slightly shorter than the plan, and thus allow a little sunlight to hit the window. That reduces the effectiveness of the shade in minimizing heat gain, but we learned from our mistake and would build it a little differently next time. 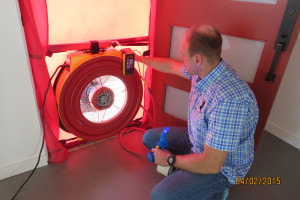 Dan Granback of Energy Inspectors conducts the blower door test Dan Granback of Energy Inspectors conducts the blower door test We set out on this energy-efficient remodel to prove that it didn’t have to cause a giant sucking sound in your wallet. To do it right, though, all energy-efficient remodels should conduct a blower door test of air-tightness, we’ve decided, after discovering its diagnostic power this week. This was a literal giant sucking sound in our house as we neared completion. The blower door test pulls air through the house with all windows and doors closed to measure how much air flows through a specific size opening. If the house has many holes in the envelope, the air flow will be high, indicating that heating and cooling load will be higher. If the house is sealed up tightly, the air flow will be low, which is the goal of an energy efficient remodel. Once the house has been designed to be a certain size and orientation to the sun, and the insulation and windows and doors have been set, and the appliances and mechanical systems have been chosen, the biggest remaining variable in performance is the construction of the building envelope. Done well, the builder seals up the envelope as he goes. Done without enough care, the building allows outside air in and the heater and air conditioner have to compensate. So it came time for the Net Zero Nest to get its report card in March when the full envelope was complete, including drywall, windows, flooring, stucco, roofing, electrical outlets, plumbing fixtures, and tile. It’s like brewing beer – you clean your equipment, choose your ingredients, boil them up, ferment, bottle, and wait a month to see how you did. In homebuilding, you frame the house, install windows and doors, seal holes with foam, drywall, caulk, and all the other steps with no feedback on how you’ve done until the blower door test. We set up the blower door at 50 mpa pressure and measured the air flow through the opening in cubic feet per minute (CFM). It was 1,670 cfm, about double our target. The target comes from taking the cubic feet of space in the house, which in our case is about 18,000, and calculating the airflow that would move 3 times the house volume through the house each hour, or 3 air changes per hour (ACH). The air flow in cfm gets multiplied by 60 to cubic feet per hour, in this case 100,000 cfh and is divided by the volume to give ACH. We started the test at 5.6 ACH, a far cry from our target of 3 !!! Now came the value of the blower door test. It pulled a negative on the entire house, and you could feel with your hand where air was being sucked into the house from outside. We found tons of places to seal that would have gone unnoticed without a blower door test:
Giant Sucking Sound, Take 2 A week later, our Energy Inspectors engineer returned to do a retest. Our permanent fixes — caulking ceiling can lights and sealing door jamb openings — had reduced airflow to 1,250 cfm. But our target was 900 cfm to equal 3 ACH, so we still had work to do. We found a vent fan that had been missed in the caulking operation, and more leaks in the laundry closet. Temporarily taping those up helped a little more. But where we decided to focus was on the floor leakage. We applied tape around the baseboards room by room, and the air flow gradually came down to about 1,000 cfm or 3.3 ACH. We were reluctant to tear the house apart at this stage of the project, so we had limited options. We decided to apply a bead of caulk around the interior base of all walls in the house to stop the leakage to the crawl space underneath permanently. This should get us very close to our target air leakage of 3 air changes per hour. Why 3 ACH? Building science nerds read on. Others may want to stop here. The most widely used measure of airtightness in the U.S. is the number of air changes per hour at 50 mpa pressure. At 3 air changes per hour, for instance, the air inside the house is replaced every 20 minutes by outside air. This is an important measure for indoor air quality, to ensure that the occupants of the space have fresh air to breathe. But it is an imperfect measure for air leakage. Why?
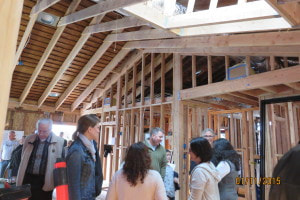
Because we felt we were casting about in the dark on air leakage, we consulted our favorite building science bloggers at Energy Vanguard and Building Science Corporation. They suggested a second helpful metric, air leakage per square feet of the building envelope. They suggested a target of 25 cfm per 100 square feet of building envelope as roughly equivalent to the 3 ACH benchmark. With our U-shaped house and vaulted great room, we have a little more envelope than a box of the same volume would. We calculated our ceiling, floor, and wall surface area to be roughly 6,100 square feet of envelope, which suggests a target of 1,525 cfm air leakage. We met that target after the first set of improvements. At 1,000 cfm, we were at about 16 on the envelope leakage measure, suggesting that our envelope was performing quite well. This gave us confidence to accept the air sealing after plugging the obvious holes and not reopen the envelope for further work. If we’d relied solely on the ACH figure, we might have been tempted to tear up the floors and start over. Note that we were unable to conduct a blower door test on the house prior to the remodel project, due to the presence of some asbestos in the attic that might have posed a hazard, and was promptly removed by the experts at ECG. We cannot compare our house to its old self, but typical houses often test at around 8 ACH or higher, so we have significantly improved our heating and cooling load and indoor air quality. Why indoor air quality? Because each air leak is a path for uncontrolled air to enter the house, from the crawlspace under the house, the attic, the garage, or the wall cavities. We believe it’s smart to close up as many of these pathways for uncontrolled air as possible and instead bring in fresh air from known locations with our supply vent fans and the windows. This way, we can ensure a healthy house and reduce space conditioning energy use. And maybe we can breathe easier when the Santa Ana winds blow and trigger our allergies every year, knowing that our house is controlling outside air infiltration. As for the question of how much air infiltration is just right… that’s up to you. New homes in our area are typically testing at around 3 ACH, and green builders can achieve 2.5 ACH. Each owner will have to weigh the cost of air sealing against the benefits – indoor air quality and reduced heating and cooling costs. We decided against spray foam insulation, for instance, which would have improved our air sealing but was expensive. Like many things about green building, air-tightness is a personal preference, so it’s up to you. 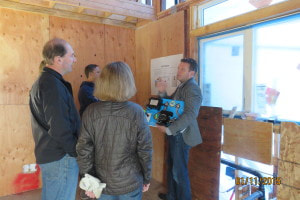 Mike Burch of D’Mand hot water systems discusses how his recirculation pump works to save water and energy Mike Burch of D’Mand hot water systems discusses how his recirculation pump works to save water and energy 200 visitors attended the “Behind the Walls Open House” event held at the house Sunday, January 11. There to answer questions were: Dan Hardey, Hardey Construction Cynthia Kraus & Claudia Wiehen, OPENHAUS Design Bryan Amburgey, Solar Source Mike Burch, D’Mand Hot Water Systems It was great to see the turnout, despite the NFL playoffs and rain that morning. The skies cleared just in time for our real-time solar demonstration. Visitors toured the project and saw many of our energy and water saving technologies first hand. We had great discussions about windows, insulation, solar energy, LED lighting, energy modeling, and more. Our most asked about feature – in-wall toilets! Our sincere thanks to everyone who came by, including our subject matter experts and partners. We look forward to having several more events when the house is complete. Future topics include low water fixtures, flooring, reclaimed materials, mechanical ventilation, and landscaping. Stay tuned for more information.  Planning a remodel? Curious about energy efficiency and lowering your utility bills? Wondering what green technologies to include in your project? If so, please join us for a unique course-of-construction open house. Holland and Nick Brown are excited to provide this educational opportunity for the community to look inside the walls of their house project to see the systems that will achieve zero net energy in their 1957 ranch home. Subject matter experts will be on hand to talk about:
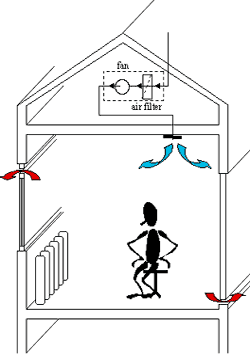 Supply Ventilation Supply Ventilation “If it ain’t broke, don’t fix it” is a common refrain in American business. In home construction, this is often invoked to defend the normal way of doing things over innovation. There is good reason for aversion to change in construction. The stakes are very high, with the threat of lawsuits a constant for builders, contractors, and manufacturers. So I always heard industry veterans say that houses are built to breathe, and that without the ability to breathe, buildings have problems with moisture, mold, and worse. The “breathing” was important, they said, because when water inevitably found its way inside the wall cavity, it had a way of escaping through a breathable wall. And find its way inside water will do, whether it’s a raised seam on the roof, a minor flashing mistake around a window, or a slow plumbing leak inside the wall. According to a recent post on Energy Vanguard, one of my favorite building science sites, 80% of all construction problems are related to water. That paradigm of breathing houses worked as long as we could tolerate materials that also leaked energy. Now that we are building houses tighter for energy efficiency and out of less breathable materials such as foam and sealing air gaps and penetrations tightly, we face a new problem… stale air inside the house. Stale air can cause serious health problems, if toxins present in interior materials accumulate inside the house without being purged. Thus was created the need for mechanical ventilation in homes. The concept of MV is that dedicated systems must be added to each home that ensure a steady supply of fresh air is circulated in the house in place of stale air. If you’re like me, you may jump to the question of why, if we are trying to minimize energy usage in the house, would we pump outside air into the conditioned space on purpose? That air needs to be heated or cooled to the interior temperature and adds to the load on the space conditioning system. The answer is that the benefit of healthy indoor air justifies the added energy expense, which is far lower than if the home were built in the traditional “breathable” way. What Type of Ventilation? There are three main ways of providing MV:
Supply ventilation fixes that problem by blowing fresh air from known locations into the house and allowing stale air to exit through holes all over the house. Thus, supply ventilation is a better choice to regulate indoor air quality. The best option is balanced mechanical ventilation, which incorporates exhaust and supply ventilation to control where air enters and exits, and the quantity of each. The simplest way to execute this is with both supply fans and exhaust fans. There are also HRVs/ERVs that provide balanced ventilation with a heat exchanger to recover some of the energy from the conditioned air that is vented. Our energy models found that HRVs/ERVs were not worth the investment in our mild climate zone, but they would surely be a good idea in extreme climates. 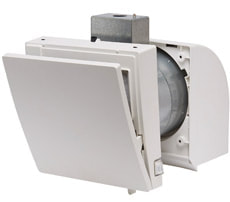 Whisper supply fan Whisper supply fan How Much Ventilation? ASHRAE has determined the minimum required cubic feet per minute (CFM) of ventilation for healthy indoor air, and the California Energy Commission has adopted their guideline. The formula is based on the square footage of the house and number of people in the house. For each 100 square feet, you need 1 cfm, plus 7.5 cfm per occupant, defined as the number of bedrooms plus 1. So for our 1950 square foot home with 4 bedrooms, we need 20+7.5*5 = 57.5 cfm running continuously. We have chosen ultra-low-energy Panasonic vent fans to provide mechanical ventilation in our house, in supply configuration to better control air quality. The Whisper Supply-Wall fan provides 20 or 40 cfm, selected by a switch on the unit, and uses only 8.5 Watts of power thanks to its efficient AC motor design. And the noise is insignificant at 1.2 sone. They have MERV-8 filters that get washed once a month to keep the air clean coming into the house. We may install two units, each at 40 cfm, on different sides of the house and run them continuously. We will also install exhaust vent fans from Panasonic to remove the moisture from each of our bathrooms after showers, and vent the laundry area. These are WhisperGreen Select units that operate at 0.3 sone and 4-11 Watts depending on the cfm setting used. These are Energy Star and use only a trickle of energy thanks to their highly efficient DC motors. They also have a very high CFM/Watt performance ratio thanks to the smart flow feature which overcomes resistance to airflow caused by ducting. 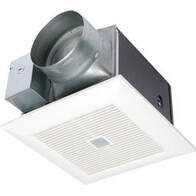 Whisper Green Exhaust Fan Whisper Green Exhaust Fan The New Tight Building Paradigm Energy-efficient homes have to be tightly built out of less breathable materials than traditionally used. With the buildings allowing reduced air flow through their walls, the need for mechanical ventilation has arisen, and products like Panasonic’s vent fans are ideal to fit this need. They require little energy to run them, make little noise, and are affordable. On the building envelope, sealing water out is essential, where in the past water penetration was managed more than eliminated. We will take great pains to seal our exterior envelope, properly flash around doors and windows, and reroof the house, because we know we can’t depend on a breathable envelope to expel moisture in the new way of building houses. Look for future posts on this topic.  Because hot water is such a big part of our overall energy load, we designed our plumbing system to minimize the energy required for our every-day uses. We purposely located several hot water usage points in close proximity. We located the water heater next to two heavily used bathrooms so that they will get instantaneous hot water (due to a very short plumbing run). And we are sizing our PEX water lines to be of minimum diameter to reduce the amount of water that must be heated to fill up the lines, while still producing sufficient flow for comfort. We will install those lines under the floor instead of in the attic to minimize the length of the runs, thereby reducing the overall amount of water that must be heated. We are also insulating the hot water lines to minimize heat loss. Some of our hardest decisions, however, were focused on how to heat and efficiently distribute the hot water. I. Heating It We were raised to be skeptical when you’re told something’s far better than what’s always worked well. Such is the tank versus tankless water heater question to us. The manufacturers trumpeted the infinite superiority of tankless water heaters and their inherent green-ness without much backup. The California Energy Code automatically docked tankless water heaters 8% of their efficiency ratings, which seemed like further proof that they were over-promising. And when we went to explore replacing our tank unit at our last house with a tankless, we discovered we’d need to upgrade the gas line to provide sufficient fuel for the big burns they use. Experts told us that you’d need a big family that uses lots of hot water to justify the expense of a tankless unit. So when it came to designing the hot water system for our net-zero house, we went in with an open mind. Our tank water heater always seemed to work well, and our gas bills were never very high. We were shocked when the energy models predicted tankless water heaters would seriously outperform tanked models. Here is what we found: Hot water represents 23% of forecast total energy use in our new house, more than space heating and cooling. So the tankless water heater found a place in our new home. There seem to be many well-respected brands out there, including Noritz, Rinnai, Takagi, A.O. Smith, and Navien. Just like our last house, we will need to upgrade the gas line to provide sufficient flow to the unit. And we’ll install it outside to keep the noise level manageable; we hear they can be loud when on full burn. 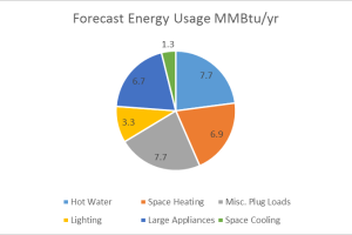 Here's what the energy models predict our home energy usage will be by system Here's what the energy models predict our home energy usage will be by system II. Distributing It Both tank and tankless water heaters have distribution challenges. One of the challenges we heard about with tankless water heaters is the hot water sandwich, in which the flow of hot water is interrupted by cold water in the lines. The big challenge with tanks is the wasted water that goes down the drain while waiting for the hot water to arrive. We went several months bucketing this water and carrying it downstairs to the landscaping in our old house, until the bucket handle broke on the stairs one day and caused a big mess. But one of our daughters is so sensitive to water waste from her guilt-laced lessons in elementary school that she gets genuinely upset at the sight of water running down the drain. She also thinks baths are water-efficient, but we haven’t burst that bubble for her yet… Anyway, there is a proven technology for managing these hot water delivery issues, the hot water recirculation pump. We are going to install the D’MAND system in our house, which fills the hot water delivery lines with hot water prior to turning on the water in the shower or sink. The unit uses only 1/10 HP and only when activated, and we will eliminate the water running down the drain and the energy used to heat that water. The company is located and manufactures exclusively in Southern California, and is run by inventor Larry Acker, who is truly an evangelist for saving water and energy. The cost is an extra $1,500 or so for the pump, dedicated return line, and installation. According to Larry, “the savings on your NetZero Home will be between 8000 to 10,000 gallons of water, close to 3000 Kilo-Watt Hours and over 12,000 to 15,000 tons of pollution, Co2, Carbon Monoxide, etc., plus the prevention of sewage processing.” 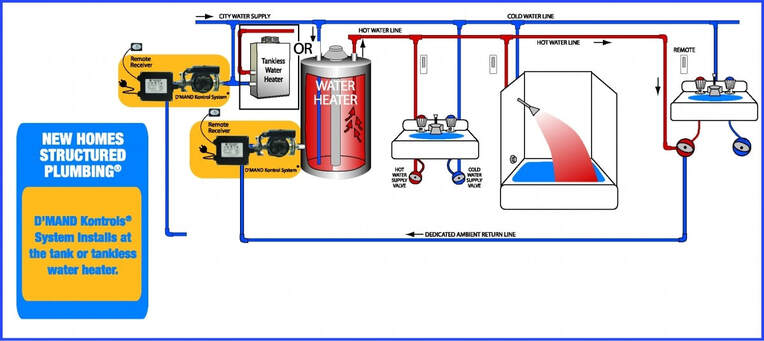 D’MAND diagram of plumbing layout with dedicated return line D’MAND diagram of plumbing layout with dedicated return line Here’s how it is installed. We will run the PEX hot water line from the tankless water heater installed outside the wall of our side-by-side bathrooms. Our remaining two major hot water use locations are on the opposite side of the house – the kitchen and the third bathroom. Hot water arriving late to the washing machine is not a concern of ours. In our system, there will be a button in the kitchen and far bathroom that we will press just prior to getting into the shower or washing dishes. That will prompt the hot water heater and pump to kick in and circulate hot water in the lines until the temperature in the lines at the far end of the loop has risen. Then the pump shuts off and the hot water is primed for use. So when we turn on the shower, the water should be almost instantly hot. We’ll have to retrain ourselves to turn on the water from inside the shower instead of brushing our teeth while it warms up down the drain. Note that these systems work best with a dedicated return line to the water heater, and can work with tank and tankless water heaters. In place of a button, a motion sensor can also be used to trigger the system. Because we felt that you can enter the bathroom and not need hot water – if you are brushing teeth or applying makeup, for example – we chose the manual button to save energy. One more note on the current state-of-the-art in tankless water heaters – condensing models. Gas hot water heaters work by producing a flame that imparts heat to the water in the tank or heat exchanger. Waste heat and combustion gases escape through a vent pipe. The tankless condensing models process the waste gases further to reclaim some of their heat, enabling the efficiency factors of some units to approach 0.96. We will use a condensing model in our home where we are fighting for every therm! |
Author Nick Brown, CEA Archives
May 2017
Categories |
Proudly powered by Weebly


 RSS Feed