|
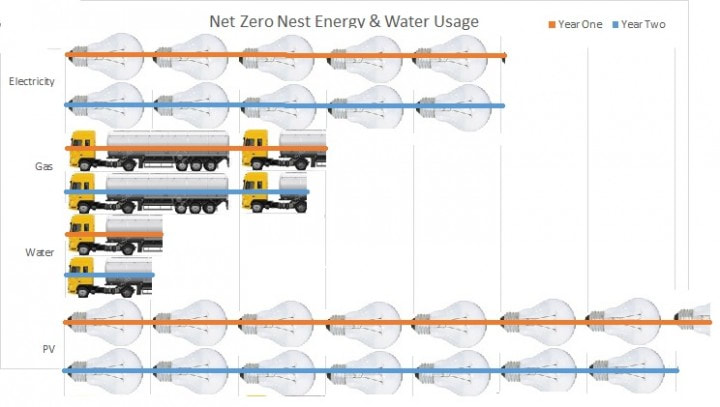
Our house used very close to the energy predicted by the models when we designed it. The above chart shows the energy usage in terms of intuitive quantities… We used about the same amount of electricity as if we left 5 100W lightbulbs on constantly, and we produced as much with our PV panels as 7 of those bulbs would use. In an average month, we consumed about 1 and a half tanker trucks of natural gas and half a tanker truck of water, and year 2 was very similar to year 1.
Each year, our net-zero energy calculation came out to 59% site net-zero. In layman’s terms, this means we produced 59% onsite with our PV panels of what we used in gas and electricity, with gas converted to kWh equivalent units. Note that California uses a time-dependent weighted valuation or TDV to compute net-zero, which weighs peak period production and consumption more heavily than off-peak. This makes achieving TDV net-zero more practical (easier) than site net-zero. Put another way, if we added 10 more PV panels to our 16, we would be site net-zero. By the California definition of TDV net zero, our house is meeting that net-zero goal as it was designed to do. We added an electric vehicle in Year 2, which is using up the extra PV production at a rate of about 200 kWh/month. That allows our Nissan Leaf to cover about 1,000 miles per month, when charging at public stations is included. Let’s look at the cost per mile. We paid $13,000 after incentives for our PV system, which generates roughly 6,250 kWh/yr. That works out to a cost of $0.10/kWh over 20 years. At 4 miles/kWh, the Leaf’s operating cost per mile is 2.5 cents. Our gas car gets 30 mpg @ $3.00/gallon, or 10 cents per mile. So the cost per mile when an EV is paired with PV panels is 1/4 that of a gas car. That is saving us $900 per year! Here are the raw numbers for you to compare your usage to. Let us know — is your house performing better than Net Zero Nest? How is your electric vehicle working out for you? We would love to hear from you. Year 1 Year 2 Electricity, kWh 4455 4423 Gas, therms 225 207 Water, cuft 8900 7300 PV production, kWh 6523 6142
3 Comments
|
Author Nick Brown, CEA Archives
May 2017
Categories |
Proudly powered by Weebly


 RSS Feed