• California Title 24
  • Services
  • Electrification
  • About Us
  • Contact
  • Blog
  • Net Zero Building
    • Net Zero Blog
  • In the News
Build Smart

Net Zero Blog

Two Years Energy Usage Data

5/22/2017

1 Comment

 
Picture
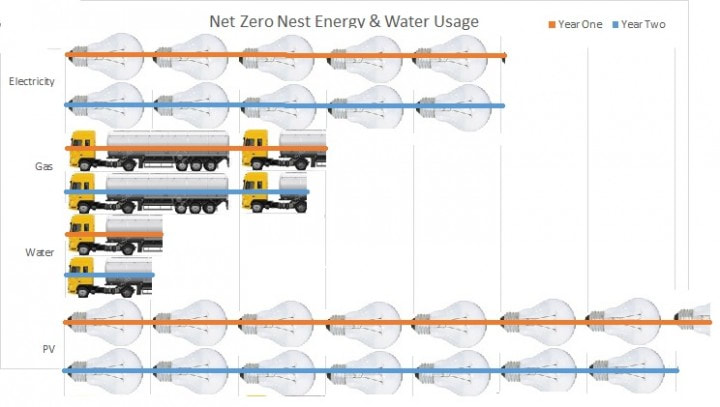
 Our house used very close to the energy predicted by the models when we designed it.  The above chart shows the energy usage in terms of intuitive quantities… We used about the same amount of electricity as if we left 5 100W lightbulbs on constantly, and we produced as much with our PV panels as 7 of those bulbs would use.  In an average month, we consumed about 1 and a half tanker trucks of natural gas and half a tanker truck of water, and year 2 was very similar to year 1.

Each year, our net-zero energy calculation came out to 59% site net-zero.  In layman’s terms, this means we produced 59% onsite with our PV panels of what we used in gas and electricity, with gas converted to kWh equivalent units.  Note that California uses a time-dependent weighted valuation or TDV to compute net-zero, which weighs peak period production and consumption more heavily than off-peak.  This makes achieving TDV net-zero more practical (easier) than site net-zero. Put another way, if we added 10 more PV panels to our 16, we would be site net-zero.  By the California definition of TDV net zero, our house is meeting that net-zero goal as it was designed to do.

We added an electric vehicle in Year 2, which is using up the extra PV production at a rate of about 200 kWh/month.  That allows our Nissan Leaf to cover about 1,000 miles per month, when charging at public stations is included.  Let’s look at the cost per mile.  We paid $13,000 after incentives for our PV system, which generates roughly 6,250 kWh/yr.  That works out to a cost of $0.10/kWh over 20 years.  At 4 miles/kWh, the Leaf’s operating cost per mile is 2.5 cents.  Our gas car gets 30 mpg @ $3.00/gallon, or 10 cents per mile.  So the cost per mile when an EV is paired with PV panels is 1/4 that of a gas car.  That is saving us $900 per year!

Here are the raw numbers for you to compare your usage to.  Let us know — is your house performing better than Net Zero Nest?  How is your electric vehicle working out for you?  We would love to hear from you.

                                                                Year 1                                   Year 2

          Electricity, kWh                   4455                                     4423

          Gas, therms                            225                                        207

          Water, cuft                              8900                                     7300

          PV production, kWh         6523                                     6142

1 Comment
Jim Thomas link
5/18/2023 09:01:06 pm

I came across your blog post titled "Two Years of Energy Usage Data" and wanted to express my appreciation for sharing such valuable insights. It's incredibly enlightening to see real-world examples of energy consumption and the impact it has on achieving net-zero goals.

Your detailed analysis of the energy usage data over the past two years provides a comprehensive understanding of the challenges and opportunities in reducing energy consumption. The breakdown of energy sources and the corresponding carbon emissions paint a clear picture of the areas that require attention for achieving net-zero targets. It's commendable to see your commitment to transparency and data-driven decision-making.

I was particularly intrigued by the case studies you presented, showcasing how energy usage patterns can vary significantly depending on building types, occupant behavior, and energy-efficient measures implemented. These examples serve as valuable lessons for building owners and operators who are striving to optimize energy performance and reduce environmental impact.

Moreover, your emphasis on the importance of occupant engagement and behavior change is noteworthy. Often, energy consumption can be influenced by the habits and practices of the individuals using the space. By promoting awareness and providing actionable tips for energy conservation, you are empowering building occupants to become active participants in the journey towards net-zero energy.

The inclusion of visualizations and graphs in your blog post significantly enhances the accessibility and comprehension of the data. It allows readers to grasp the trends, patterns, and potential areas for improvement at a glance. Additionally, your integration of renewable energy sources, such as solar panels, and the subsequent reduction in grid reliance is a testament to the effectiveness of sustainable energy solutions.

I want to express my gratitude for sharing your experiences and lessons learned. The insights you have provided will undoubtedly inspire and guide others in their pursuit of energy efficiency and carbon neutrality. By showcasing the tangible results of your efforts, you are setting a positive example for the industry as a whole.

Reply


Leave a Reply.

    Author

     Nick Brown, CEA
    President, Build Smart Group
    ​Owner of the Net Zero Nest

    Archives

    May 2017
    December 2016
    September 2016
    July 2015
    April 2015
    January 2015
    December 2014
    November 2014

    Categories

    All

    RSS Feed

Proudly powered by Weebly
  • California Title 24
  • Services
  • Electrification
  • About Us
  • Contact
  • Blog
  • Net Zero Building
    • Net Zero Blog
  • In the News